


IN THIS ARTICLE:
Key Takeaways
1
Strategies to increase conversion rate start with matching the message to the funnel stage, not redesigning pages.
2
Reducing form fields from 11 to 4 can increase conversion rates by 120%.
3
Traffic without intent is expensive noise; micro-conversions reveal where buyers actually drop off.
4
B2B conversion rates average 2–5%. Top performers hit 2–3x that through systematic optimization.
5
Every additional form field, unanswered question, or friction point reduces conversion rate at BOFU.
Strategies to increase conversion rate matter most when you realize your traffic isn't the problem but your funnel is.
The average Google Ads conversion rate across all industries is just 7.52%, but most B2B companies are converting at a fraction of that, with the same budget, the same traffic, and no clear visibility into where the drop-off happens.
This guide covers 17 proven strategies, across landing pages and Google Ads. They are linked to every funnel stage. The aim is to close existing gap and turn existing traffic into pipeline.
Let’s get started.
TL;DR
Most conversion problems aren't traffic problems. This guide gives you 17 tactics to fix them: why optimization efforts fail, how to diagnose your funnel by stage, what Google Ads conversion looks like done right, industry benchmarks to measure yourself against, and a framework to start acting today.
{{button: Explore our Service | https://scalixai.com/services/ppc-management-services}}
What Is a Conversion Rate?
A conversion rate measures the percentage of visitors who complete a desired action on your website. The formula is simple:
Conversion Rate = (Conversions ÷ Total Visitors) × 100
If 100 people visit your landing page and 3 complete your form, your conversion rate is 3%. However, understanding what constitutes a 'conversion' requires nuance.
Micro-conversions vs. Macro-conversions:
Macro-conversions: Primary business goals, such as purchases, demo requests, qualified leads.
Micro-conversions: Smaller engagement actions, including email signups, downloads, video views.
Most businesses obsess over macro-conversions while ignoring micro-conversions that indicate buying intent. This is a critical mistake. Improving conversion rates often starts with optimizing the micro-conversion path that leads to macro-conversions.
Average Conversion Rates by Industry (2026)
The B2B Conversion Benchmark Report offers an analysis of 100M+ data points across 14 industries.
Industry | Average Conversion Rate | Top Performers |
E-commerce | 2.5–3.5% | 5%+ |
SaaS | 3–7% (freemium: 1–3%) | 8%+ |
B2B Lead Generation | 2–5% | 6%+ |
Professional Services | 5–10% | 12%+ |
Finance & Insurance | 5–15% | 15%+ |
Healthcare | 3–8% | 10%+ |
These are averages. Top-performing companies hit 2–3x these numbers through systematic, funnel-stage optimization, not one-off page redesigns.
The Conversion Funnel Framework: Why User Intent Drives Everything
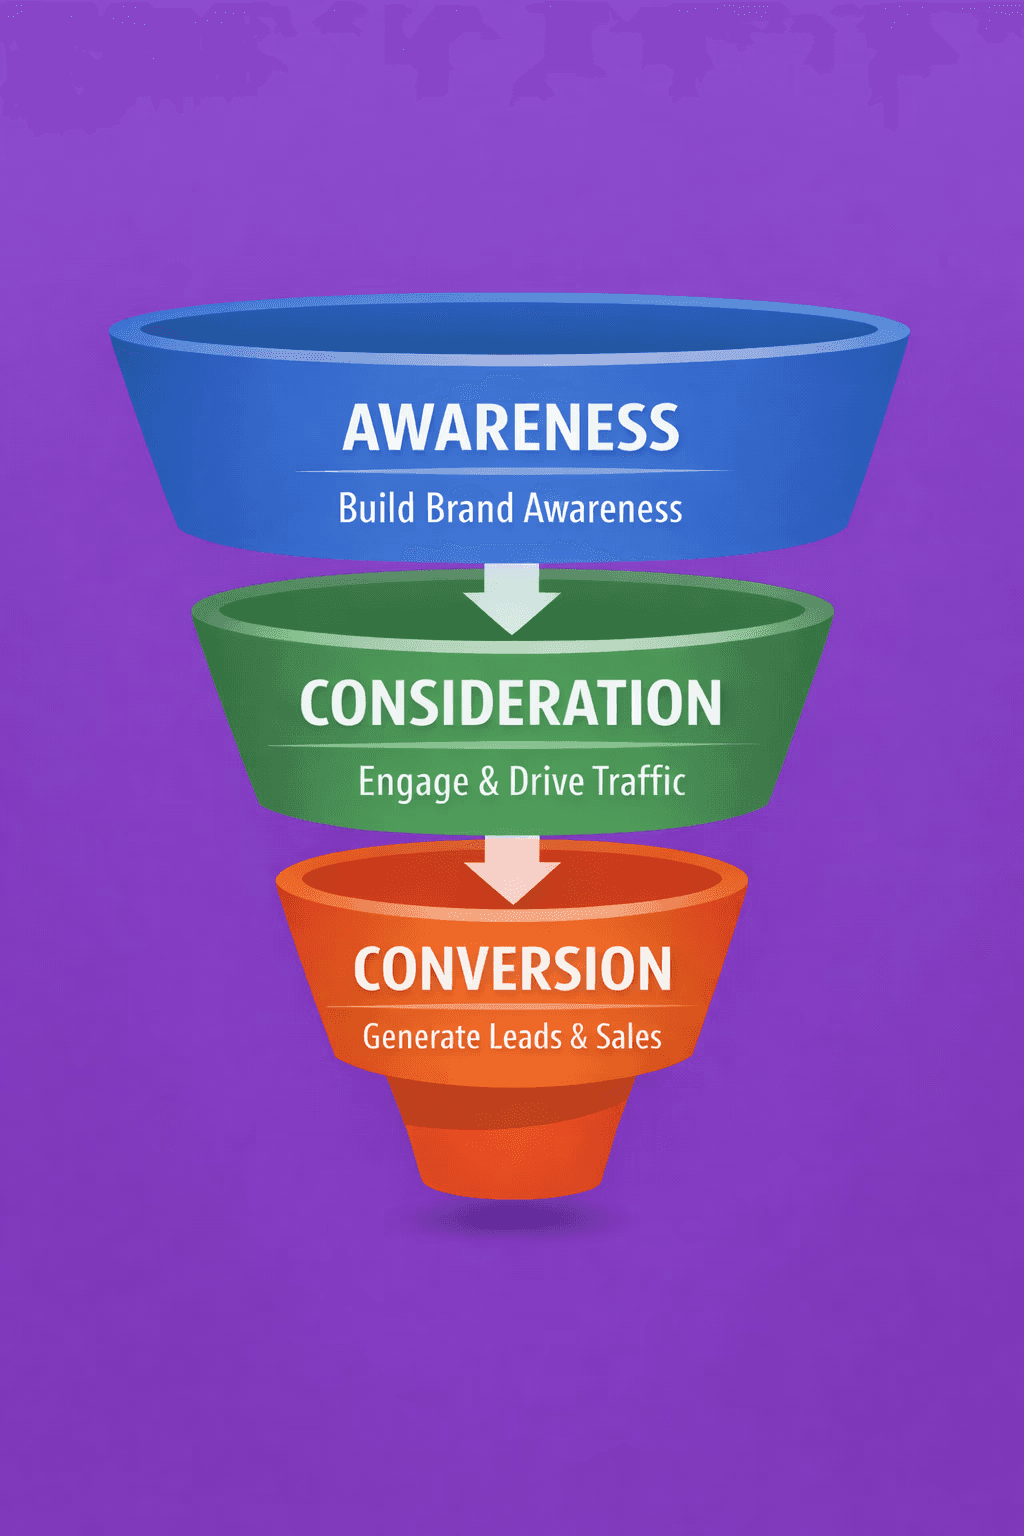
Most conversion optimization failures stem from a fundamental misunderstanding: treating all visitors the same. People arrive at your website with vastly different intentions, awareness levels, and readiness to convert.
The conversion funnel maps the journey from initial awareness to final decision. Optimizing Google Ads for conversion requires matching your messaging, offers, and user experience to each funnel stage.
Top of Funnel (TOFU): Awareness Stage
User Intent:
Visitors are discovering their problem or researching solutions. They're not ready to buy. Right now they're gathering information, comparing options, and building understanding.
Conversion Goals:
Content downloads (guides, checklists, templates)
Email newsletter signups
Video views or webinar registrations
Social follows or community joins
Optimization Strategy:
Focus on value-first offers that require minimal commitment. Educational content that addresses specific pain points performs best. Avoid asking for too much information. Email and name are sufficient.
Middle of Funnel (MOFU): Consideration Stage
User Intent:
Visitors understand their problem and are actively evaluating solutions. They're comparing features, pricing, and credibility signals. Trust becomes the primary conversion barrier.
Conversion Goals:
Free trial signups
Demo requests or consultation bookings
Product comparison interactions
Case study downloads
Optimization Strategy:
Use social proof aggressively. Customer testimonials, case studies with specific results, trust badges, and third-party reviews dramatically improve conversion rates at this stage. Comparison pages that honestly position your solution against competitors build credibility.
Bottom of Funnel (BOFU): Decision Stage
User Intent:
Visitors are ready to buy but need final reassurance. They're comparing final details, looking for guarantees, and seeking reasons to choose you over competitors.
Conversion Goals:
Purchases or paid subscriptions
Contract signings
High-value lead submissions
Optimization Strategy:
Eliminate friction ruthlessly. Every additional form field, confusing step, or unanswered question reduces conversion rates. Money-back guarantees, risk reversals, and clear next-step explanations are conversion rate multipliers.
17 Proven Strategies to Improve Conversion Rates
These evidence-based tactics are ranked by impact potential and ease of implementation. Start with strategies 1-5 for quick wins, then systematically work through the remaining techniques.
Strategy 1: Eliminate Form Friction with Smart Field Optimization
Form abandonment is the silent killer of conversion rates. Reducing form fields from 11 to 4 can increase conversion rates by up to 120%. Every field you ask for must justify its existence with a clear business reason.
Actionable Implementation:
Audit every form and remove fields that aren't absolutely necessary
Use progressive profiling: collect basic info first, gather details later
Implement smart defaults and autofill wherever possible
Mark truly optional fields clearly (most users will skip them anyway)
Add inline validation that confirms correct entries in real-time
Expected Impact:
Properly optimized forms typically see 25-60% improvement in conversion rates within the first week of implementation.
Strategy 2: Deploy Hyper-Specific Value Propositions
Generic value propositions are conversion killers. 'Best-in-class solution' or 'Industry-leading platform' communicate nothing. Your value proposition must answer one question instantly: Why should I choose you instead of doing nothing or choosing a competitor?
Actionable Implementation:
Replace vague claims with specific, measurable outcomes
Lead with the transformation, not the features
Use customer language from reviews and support tickets
Test headline variations that emphasize different benefits
Example:
Weak: 'The Best CRM for Growing Businesses'
Strong: 'Close 34% More Deals in 90 Days with AI-Powered Follow-Up (Without Hiring More Sales Reps)'
Strategy 3: Implement Strategic Social Proof at Decision Points
Social proof increases conversion rates by reducing perceived risk. However, most businesses implement social proof poorly—displaying generic testimonials that don't address specific objections or placing them where they have minimal impact.
Types of Social Proof Ranked by Effectiveness:
Customer success stories with specific metrics (most powerful)
Video testimonials showing real people and results
Third-party reviews (G2, Capterra, Trustpilot)
Trust badges and security certifications
Client logos (least impactful unless Fortune 500 brands)
Placement Strategy:
Place objection-specific testimonials near related content
Display trust badges near payment or form submission buttons
Show real-time activity ("23 people signed up this week") when authentic
Expected Impact:
Well-implemented social proof typically improves conversion rates by 15-30% on high-intent pages.
Strategy 4: Optimize Page Load Speed to Sub-2 Seconds
Page speed isn't just a technical SEO factor. It directly impacts conversion rates. Google's research shows that as page load time goes from 1 to 3 seconds, bounce probability increases by 32%. From 1 to 5 seconds? It jumps to 90%.
Critical Speed Optimizations:
Compress images using modern formats (WebP, AVIF)
Implement lazy loading for below-the-fold content
Minimize JavaScript execution time
Use a content delivery network (CDN) for global audiences
Enable browser caching for repeat visitors
Tools to measure impact: Google PageSpeed Insights, GTmetrix, WebPageTest
Strategy 5: Create Urgency Without Manipulation
Authentic urgency accelerates decision-making and can increase conversion rates by 20-50%. However, fake countdown timers and false scarcity destroy trust and damage long-term conversion potential.
Ethical Urgency Tactics:
Limited-time promotions tied to real events (seasonal, product launches)
Genuine inventory scarcity for physical products
Cohort-based programs with actual enrolment deadlines
Early-bird pricing that expires at specified dates
Avoid: Evergreen countdown timers, fake "only 3 left" messages, or urgency that resets for every visitor.
Strategy 6: Master Mobile Conversion Optimization
Mobile devices now account for over 60% of web traffic, but mobile conversion rates typically lag desktop by 30-50%. This gap represents enormous untapped potential.
Mobile-Specific Optimization Checklist:
Thumb-friendly buttons (minimum 48x48 pixels, 8px spacing)
Single-column layouts that eliminate horizontal scrolling
Click-to-call buttons prominently placed
Mobile-optimized forms using appropriate input types
Digital wallet integration (Apple Pay, Google Pay)
Sticky CTAs that remain visible while scrolling
Expected Impact:
Comprehensive mobile optimization typically closes 40-70% of the desktop-mobile conversion gap.
Strategy 7: Implement Exit-Intent Technology Strategically
Exit-intent popups detect when users are about to leave and present a last-chance offer. When implemented correctly, they can recover 10-15% of abandoning visitors without harming user experience.
Best Practices:
Only trigger once per visitor per 30 days
Offer genuine value (discount, bonus content, extended trial)
Make closing the popup obvious and frictionless
Segment offers based on pages visited or time spent
Don't use exit-intent on mobile devices—the technology is unreliable and creates poor user experience.
Strategy 8: Reduce Cognitive Load with Progressive Disclosure
Overwhelming visitors with too many choices, too much information, or complex decision trees tanks conversion rates. Progressive disclosure reveals information gradually, matching the visitor's growing commitment level.
Implementation Examples:
Multi-step forms instead of single long forms
Expandable sections for detailed feature information
Tiered pricing with 'Learn More' for detailed comparisons
Guided product finders that ask qualifying questions
The key principle: show what's necessary now, defer what can wait.
Strategy 9: Optimize Call-to-Action Copy and Design
Your CTA button might be the most important conversion element on your page. Yet most businesses use generic phrases like 'Submit' or 'Learn More' that communicate nothing about value or next steps.
High-Converting CTA Formulas:
Action + Benefit: 'Get My Free Audit' instead of 'Submit'
First-person language: 'Start My Trial' vs 'Start Your Trial'
Specific outcomes: 'Show Me How to Save $500/Month'
Time-bound commitments: 'Try Free for 14 Days'
Design Elements That Matter:
Contrasting colors that stand out from page background
Adequate white space around buttons (increase tap accuracy)
Clear visual hierarchy with primary vs secondary CTAs
A/B test CTA copy relentlessly—small wording changes can improve conversion rates by 20-40%.
Strategy 10: Leverage Personalization Based on Visitor Behavior
Personalization has been shown to improve conversion rates by over 200% compared to generic experiences. Modern personalization goes far beyond inserting a first name—it adapts entire page experiences based on visitor behavior, source, and intent signals.
Personalization Opportunities:
Show industry-specific case studies based on referring domain
Display relevant products based on browsing history
Customize headlines for different traffic sources
Adjust CTAs for returning vs first-time visitors
Geographic personalization for local offerings
Start simple with segmentation by traffic source, then progressively add behavioral triggers as you collect data.
Strategy 11: Implement Risk Reversal Guarantees
Risk reversal eliminates the perceived downside of taking action. Money-back guarantees, free trials, and satisfaction promises can increase conversion rates by 30-60% when prominently displayed.
Effective Risk Reversals:
Specific timeframe guarantees (30-day money-back, not just 'satisfaction guaranteed')
No-questions-asked refund policies
Free cancellation up to specific dates
Results guarantees with refund conditions
The stronger and clearer your guarantee, the more powerful the conversion lift.
Strategy 12: Optimize Checkout Flow for E-commerce
Cart abandonment averages 69.8% across industries. Checkout optimization focuses on removing obstacles between add-to-cart and completed purchase.
Checkout Optimization Tactics:
Guest checkout option (forced account creation kills conversions)
Clear progress indicators for multi-step checkout
Multiple payment methods including digital wallets
Transparent shipping costs displayed early
Cart abandonment email sequences (recover 5-11% of abandoned carts)
Trust badges near payment submission
Expected Impact:
Checkout optimization can reduce abandonment rates by 20-35%, directly increasing revenue without additional traffic.
Strategy 13: Deploy Live Chat at Critical Decision Points
Live chat can increase conversion rates by 45% when implemented strategically. The key is offering help exactly when visitors need it, not annoying them with premature popups.
Strategic Implementation:
Trigger chat prompts based on time on page (60+ seconds)
Offer help on pricing and product pages specifically
Use chatbots for qualification, humans for closing conversations
Display average response time to set expectations
Don't: Auto-open chat immediately, use aggressive prompts, or promise instant response without staffing to deliver.
Strategy 14: Implement A/B Testing as Core Practice
A/B testing transforms conversion optimization from guesswork into data-driven decision-making. Companies that consistently test improve conversion rates 2-3x faster than those relying on best practices alone.
High-Impact Elements to Test:
Headlines and value propositions
CTA button copy and colors
Form length and field labels
Social proof placement and format
Pricing page layouts
Hero images vs videos
Testing Framework:
Identify conversion bottlenecks through data analysis
Develop hypothesis based on visitor research
Run test until statistical significance (95% confidence)
Implement winner and start next test
Tools: Google Optimize, Optimizely, VWO, Convert
Strategy 15: How to Improve Conversion Rate in Google Ads
Google Ads conversion rates require different optimization approaches than organic traffic. The average Google Ads conversion rate is 3.75% across industries, but top performers achieve 10%+ through strategic campaign structure and landing page alignment.
Optimizing Google Ads:
Here's a quick Google Ads optimization checklist:
Message match: Landing page copy aligns with ad copy
Bounce Rate: Percentage of single-page sessions
Average Session Duration: Time spent on site
Pages Per Session: Engagement depth
Exit Rate: Where visitors leave your funnel
Form Abandonment Rate: Where users quit filling forms
Advanced Tactic:
Create dedicated landing pages for high-performing keywords instead of sending all traffic to homepage. This alignment alone can double Google Ads conversion rates.
Strategy 16: Optimize for Conversion Intent Keywords
Not all keywords indicate equal buying intent. Someone searching 'how to increase conversion rate' is researching, while someone searching 'conversion rate optimization consultant' is ready to hire. Aligning content with search intent dramatically improves conversion rates.
Keyword Intent Hierarchy:
Transactional Intent (Highest): 'buy', 'pricing', 'hire', 'consultant'
Commercial Intent: 'best', 'top', 'review', 'vs', 'alternative'
Informational Intent: 'how to', 'what is', 'guide', 'tips'
Navigational Intent (Lowest): Brand searches
Optimization Strategy:
Transactional keywords → Product/pricing pages with strong CTAs
Commercial keywords → Comparison/review content with demo CTAs
Informational keywords → Educational content with lead magnet CTAs
Match your conversion goal to the keyword intent. Asking for a purchase on informational content creates friction and lowers conversion rates.
Strategy 17: Use Video to Increase Conversion Rates
Video on landing pages can increase conversion rates by 80% or more when implemented strategically. Video communicates complex information quickly, builds trust through human connection, and keeps visitors engaged longer.
High-Converting Video Types:
Product demo videos (2-3 minutes showing key features)
Customer testimonial videos (60-90 seconds)
Explainer videos that simplify complex solutions
Behind-the-scenes content building brand connection
Implementation Best Practices:
Auto-play on mute (let visitors choose to enable sound)
Add captions for accessibility and silent viewing
Place videos above the fold on high-intent pages
Include CTA at video end or as overlay
Optimize video file size to prevent page slowdown
Test video vs static images—results vary by industry and audience, but SaaS and complex B2B products see the strongest video conversion lifts.
Measuring Success: Conversion Metrics That Actually Matter
Most businesses misread conversion data because they track surface-level metrics without connecting them to revenue impact. Effective CRO measurement focuses on conversion quality, not just volume.
Core Conversion Metrics
Metric | What It Measures | Why It Matters |
Overall Conversion Rate | Conversions ÷ total visitors | Baseline performance indicator |
Micro-Conversion Rate | Small actions (clicks, signups, add-to-cart) | Predicts future conversions |
Conversion by Traffic Source | Performance by channel (SEO, ads, social) | Identifies high-intent traffic |
Landing Page Conversion Rate | Individual page performance | Pinpoints optimization opportunities |
Behavioral & Funnel Health Metrics
Metric | What It Indicates |
Bounce Rate | Relevance of landing experience |
Average Session Duration | Content engagement depth |
Pages Per Session | User exploration intent |
Exit Rate | Funnel drop-off points |
Form Abandonment Rate | Friction in lead capture flow |
Critical CRO Rule (Often Ignored)
Conversion rate alone is misleading.
A higher conversion rate is meaningless if it reduces revenue quality.
Always evaluate CRO alongside:
Revenue per visitor (RPV)
Customer acquisition cost (CAC)
Customer lifetime value (LTV)
Average order value (AOV)
Optimization is not about more conversions; it’s about more valuable conversions.
While working with Portless, conversion performance was improved by shifting focus from generic conversion rate tracking to a full-funnel measurement approach, including micro-conversions, traffic-source quality, and revenue-per-visitor alignment.
This allowed clearer identification of high-intent traffic and reduced reliance on low-quality conversions that inflated surface metrics but didn’t contribute meaningfully to revenue.
Read Complete Portless Case Study
Tools for Conversion Tracking
Google Analytics 4: Free comprehensive analytics
Hotjar or Microsoft Clarity: Heatmaps and session recordings
Google Optimize or Optimizely: A/B testing platforms
Crazy Egg: Visual analytics and testing
Mixpanel or Amplitude: Advanced product analytics
Start with free tools (Google Analytics, Clarity) before investing in premium platforms. Most businesses don't need expensive tools—they need disciplined implementation of basics.
7 Mistakes That Kill Conversion Rates
Even sophisticated marketers make these conversion-killing errors. Avoid them to protect your optimization gains.
Testing Without Sufficient Traffic: Running A/B tests with <1,000 visitors per variant produces meaningless results. Wait until you have statistical significance.
Optimizing for the Wrong Conversion Goal: Maximizing email signups doesn't help if they never become customers. Optimize for business outcomes, not vanity metrics.
Ignoring Mobile Users: Mobile represents 60%+ of traffic but gets treated as an afterthought. Mobile-first optimization is non-negotiable in 2026.
Making Changes Based on Opinion Instead of Data: Your preferences don't matter. What visitors do matters. Always test major changes.
Overwhelming Visitors with Too Many Options: Analysis paralysis is real. Limit primary CTAs to one per page, choices to 3-5 maximum.
Forgetting to Optimize the Full Funnel: A brilliant landing page can't overcome a terrible checkout experience. Optimize every step from traffic source to thank-you page.
Stopping After One Win: Conversion optimization is continuous, not a one-time project. Top performers run 50+ tests annually.
Each of these mistakes can reduce your potential conversion rate by 20-50%.
Avoiding all seven could literally do the businesses that master conversion rate optimization extract maximum value from every marketing dollar spent. They grow faster, acquire customers more efficiently, and build sustainable competitive advantages.
The Bottom Line
If your traffic is there but your pipeline isn't, the 17 strategies in this guide will show you exactly where conversion is breaking down.
ScalixAI can help you fix it at the paid media level, where traffic quality and landing page alignment directly determine how many of those visitors actually become revenue through our Google Ads management for B2B companies.
Your Traffic Isn't Converting. Here's Why.
We audit your Google Ads and landing page together, and show you exactly where you're losing revenue.
Get Your Free Conversion Audit →
What is a good conversion rate?
How long does it take to see results from CRO efforts?
How do I improve conversion rate in Google Ads specifically?
What's the fastest way to increase conversion rates?
Should I focus on increasing traffic or improving conversion rates?
